Exploring Estuary with flowctl: A Beginner’s Hands-On Guide

Hello there! I decided to dive in and learn how to use Estuary’s command-line tool, flowctl, to tinker with data flows from my terminal. In this post, I'll share my journey, starting with what Eestuary is and why the CLI can be awesome, and then walking through beginner-friendly examples of flowctl – from basic commands to more advanced tricks. By the end, you should have a solid feel for when and how to use flowctl in your own data adventures.
What is Estuary Flow?
Estuary is a real-time data movement platform – think of it as a toolkit to continuously move and transform data between systems. It’s designed to integrate all your systems to produce, process, and consume data, unifying batch and streaming pipelines into one real-time flow. With Flow, you can build end-to-end data pipelines that connect sources and destinations and keep them in sync with low-latency updates.
In other words, Flow helps ensure your data is always up-to-date everywhere, in milliseconds.
Flow at a glance: Flow pipelines consist of captures (ingesting data from sources), collections (storing data as JSON in a real-time data lake), and materializations (delivering data to downstream systems). You define these data flows (catalogs) using the Flow web UI or the flowctl CLI. The platform handles processing and storage, so new data is captured, stored, and pushed continuously to targets.
In Flow’s terminology, a complete pipeline usually has three main components:
- Capture – a connector continuously pulls data from an outside source into Flow. For example, capturing change events from a PostgreSQL database.
- Collection – a Flow-managed dataset (a collection of JSON documents) where captured data lands. Collections act like a real-time data lake stored as JSON files in cloud storage. They retain all historical data, adding new data as append-only records.
- Materialization – a connector that continuously pushes data from a collection out to an external system for consumption. For example, materializing the collection into a Snowflake table, a CSV file, or an API.
Optionally, there are also Derivations (derived collections created by transforming other collections in real-time). All these pieces (captures, collections, materializations, derivations, schemas, etc.) together form a catalog – essentially the configuration of your data flows.
So, what does Estuary’s platform give you? In a nutshell, the ability to define what data you want to sync from point A to B (and possibly transform it on the way) and Flow will handle how to do it reliably and in real-time. You can set this up through a friendly web app or via flowctl – and that’s where our CLI adventure begins.
Why use the flowctl CLI?
Estuary provides a web application for building and monitoring data flows (if you sign into the Estuary dashboard, you can click around to create captures, see collections, etc.). However, there’s a parallel universe for controlling flow via the command line. flowctl is the official CLI for working with Estuary Flow’s API. Anything you can do in the UI – and more – you can also do with flowctl. So why bother with a CLI if there’s a nice UI?
For me, the CLI opens up possibilities for automation and deeper exploration:
- Scripting & Automation: If you want to integrate Flow tasks into scripts or CI/CD pipelines, flowctl is indispensable. You can automate data flow deployments, run validations, or extract data as part of a larger workflow, all in code. This beats clicking in a UI for repeatable tasks.
- Version Control & GitOps: The CLI lets you pull your Flow specs into local files, edit them, and push updates. You can manage your data flow configurations in Git, just like application code. (For example, you might create a Flow pipeline in the web app, then use flowctl to fetch it into YAML files you check into a repository.)
- Direct Data Access: flowctl gives you a direct window into the data in your collections. You can read your JSON documents from a collection in real-time on your terminal. This is super handy for quick sanity checks – e.g., verifying that a capture from PostgreSQL is indeed bringing in the expected records without writing any SQL or going to the destination system.
- Advanced Features: Some of Flow’s more advanced capabilities are only available via CLI. For instance, you can manage authentication tokens and roles or generate TypeScript modules for custom transformations (user-defined derivations) using flowctl, which are things that might not yet be exposed in the UI. The CLI offers “power-user” operations for those who need them.
- Consistency Across Environments: With flowctl, you can consistently interact with any Flow catalog you have access to – whether it was created in the UI or via CLI. This means if you’re collaborating with others, some using the UI and some using CLI, everyone can work on the same flows through their preferred interface.
Finally, as a terminal enthusiast, I just find it fun and efficient to poke around with a CLI. It gives me that feeling of control – like I’m directly under the hood of the data plane – which can be educational and valuable for troubleshooting.
Tip: Flow’s CLI and UI are complementary. You can freely switch between them; the underlying data flows are the same. Use the web app for easy visualization and flowctl for automation or digging into details. Together, they form Flow’s “unified” platform for managing pipelines.
Now that we know why the CLI is worth trying let’s install it and start playing!
Installing flowctl
Getting flowctl set up is straightforward. It’s a single self-contained binary (no heavy dependencies), and it’s currently available for MacOS and Linux. (Windows users: you can run it via Windows Subsystem for Linux or a container since a native Windows build isn’t available.)
Here’s how to install flowctl for your platform:
- Linux: Run the following in your terminal. This command downloads the latest flowctl binary and makes it available system-wide:
sudo curl -L https://github.com/estuary/flow/releases/latest/download/flowctl-x86_64-linux \
-o /usr/local/bin/flowctl && sudo chmod +x /usr/local/bin/flowctl- MacOS: You can either use a similar curl command or Homebrew. Using curl:
sudo curl -L https://github.com/estuary/flow/releases/latest/download/flowctl-multiarch-macos \
-o /usr/local/bin/flowctl && sudo chmod +x /usr/local/bin/flowctl- Or via Homebrew (if you have Homebrew installed):
brew tap estuary/flowctl
brew install flowctl
After running the above, you should be able to verify it’s installed by checking the version:
(Your exact version will vary; at the time of writing, the latest was 0.5.x.)
Authentication: Once flowctl is installed, you need to authenticate it with your Estuary Flow account before you can do anything interesting. Flow uses token-based auth for the CLI. The easiest way to log in is:
- Run flowctl auth login. This will open a web browser window to the Estuary Flow dashboard’s CLI API tab (make sure you’ve already created an Estuary account and are logged in on the web).
- Copy the presented access token (a long string starting with estuarytok-...).
- Paste the token back into your terminal when prompted.
Alternatively, copy the token first and run: flowctl auth token --token <paste-your-token-here>. Either way, once the token is stored, flowctl will remember it (usually stored in a config file in your home directory) and use it for subsequent commands. Tokens expire after some time, so you might need to re-authenticate occasionally.
Now we’re all set up and authenticated. Let the exploration begin!
Exploring Data with flowctl
One of the most exciting things for me as a beginner was the ability to peek directly at the data flowing through my collections. Suppose I have a Flow capture set up from a PostgreSQL database (perhaps capturing new orders from an orders table), and it's written into a Flow collection named acmeCo/sales/orders. There might also be a materialization sending those orders onward to Snowflake. But before even checking Snowflake or any downstream system, I can use flowctl to inspect the collection in real time.
Reading documents from a collection
Let’s say I want to see what the data in acmeCo/sales/orders looks like. I can use the flowctl collections read command to read from a collection. This will stream the JSON documents of the collection to my terminal:
$ flowctl collections read --collection acmeCo/sales/orders --uncommittedThis command connects to the collection and outputs documents continuously (similar to how tail -f works on logs, but for live data). The --uncommitted flag is currently required (Flow is in beta) to indicate we want all documents, even those not yet fully committed. You can cancel the stream after seeing a few records by pressing Ctrl+C (otherwise, it may keep running if data continues to flow in).
For example, after running the above, I immediately see a JSON document printout:
{
  "_meta": {
    "uuid": "72c6f720-bf5e-11ed-b9c6-0242ac120002"
  },
  "order_id": 12345,
  "customer": "Alice",
  "total": 99.95,
  "timestamp": "2025-03-26T13:45:10Z"
}
(This is a fabricated example document for illustration but shows the general structure. Every document has a special _meta field with metadata like a UUID, followed by the actual data fields – in this case, order_id, customer, total, etc.)
If you see a stream of JSON like the above on your terminal, congratulations – you just tapped into your data stream! (The first time I did this, I felt super happy seeing live data scroll by in the console.)
Reading in batches or from specific points: By default, collections read will start from the earliest data in the collection and stream onward. For very large collections, that could be a lot. Often, you might only want recent data. The CLI provides options to refine your reading. For example, --since "1h" would start reading from roughly one hour ago, and you can use other time units (e.g. --since 5m for 5 minutes). You can also filter by a specific partition if your collection is partitioned – using --include-partition key=value – only to read data for a subset (say one customer or region). Running flowctl collections read --help will show all available flags. Feel free to experiment with these to get just the data you need.
Inspecting fields and values
Now that we can read data, we might want to dig into it. A beginner question is often: “What unique IDs or field values exist in this collection?” For instance, you might want to list all unique customer IDs or see the range of timestamps. While flowctl doesn’t (currently) have a dedicated query language for aggregations, we can leverage the JSON output and some CLI magic to explore.
Since flowctl prints JSON, we can pipe the output to tools like jq (a JSON processor) or grep. Here’s an example of listing unique order IDs (order_id field) from our acmeCo/sales/orders collection:
$ flowctl collections read --collection acmeCo/sales/orders --uncommitted --since "24h" \
    | jq -r '.order_id' | sort -n | uniq
12345
12346
12349
12350
Let’s break that down:
- flowctl collections read ... --since "24h" streams the last 24 hours of data from the collection.
- We pipe (|) that output into jq. The filter .order_id tells jq to extract the order_id field from each JSON object. The -r flag outputs it as raw text (so we just get the number per line).
- Then, we sort the numbers and use uniq to remove duplicates.
The result is a list of unique order IDs seen in the past day. You could do the same for a customer field or a timestamp field. For instance, changing .order_id to .customer would list unique customer names. Or perhaps you want to see all distinct dates present. If there’s a date field, extract it and uniq it.
This kind of quick exploration is incredibly useful for validating assumptions. For example, if I expect only specific customers or IDs, I can verify none are missing or unexpected ones aren’t appearing. It’s also a great way to double-check that your primary keys are genuinely unique, see if data is coming in sorted by time, etc.
Note: The above pipeline will eventually read all documents in the timeframe. You might not want to do that casually if the collection is huge. You can always stop it with Ctrl+C after you think you’ve seen enough. Flow may support a direct --limit on reads or more interactive queries in the future. But as a workaround, sometimes I just pipe to head -n 100 to grab a sample of 100 documents, then analyze those.
Listing collection journals and fragments
Under the hood, Flow stores collection data in journals, which are like append-only logs, and these journals consist of fragments (regular files in cloud storage that contain chunks of your JSON data). Why might a beginner care about this? One reason is to verify where your data is stored and how it’s partitioned, especially if you plan to access it outside of Flow (say, using Snowflake or Spark on the raw files).
We can use flowctl to list the journals or fragment files that comprise a collection. This gives insight into how data is shared and stored. For example:
$ flowctl collections journals --collection acmeCo/sales/orders
Running the above might output something like:
JOURNAL                                         FRAGMENTS
acmeCo/sales/orders/part-0000                  12 fragments
acmeCo/sales/orders/part-0001                  8 fragments
This illustrative output shows that our orders collection has two journals (maybe it’s partitioned by some key, and Flow automatically created two physical partitions). Each line indicates a journal (often naming includes the collection and a partition identifier) and how many fragment files are in it. You’d likely see just one journal if the collection isn't partitioned.
We can drill down further and list the fragment files for a specific journal:
$ flowctl collections fragments --collection acmeCo/sales/orders --journal part-0000
Example output snippet:
Fragment                                                          Size        Last Modified
s3://my-bucket/flow/acmeCo/sales/orders/part-0000/0000000000-0000001234.gz   5.2 MB     2025-03-25T12:00:00Z
s3://my-bucket/flow/acmeCo/sales/orders/part-0000/0000001235-0000002345.gz   4.8 MB     2025-03-26T08:30:00Z
...
Here, we see actual fragmented files in cloud storage (on S3, in this example). Each file name encodes an offset range (from 0 to 1234, then 1235 to 2345, etc.), which tells us which portion of the journal’s log is contained in that fragment. We also see the file sizes and timestamps.
Why is this useful? For one, it confirms that your data is safely and durably stored in cloud storage (so Flow isn’t a black box – you can always go and inspect or even download these files directly if needed). It also tells you the storage location (bucket and path). For instance, if you were configuring Snowflake to read this data via an external table, you’d need to know the bucket and prefix. Flow’s storage mapping ensures all collection fragments share a common prefix – here s3://my-bucket/flow/acmeCo/sales/orders/part-0000/ (and similarly for part-0001).
Moreover, seeing the partitioning can explain how Flow is scaling your pipeline. More partitions (journals) mean that flow can be ingested and processed in parallel for higher throughput. As a beginner, you usually don’t need to manage this (Flow auto-scales partitions) manually, but it’s cool to see it.
To summarize this section, with just a few commands, we confirmed that our Postgres source captures data (by reading documents). We examined those documents for expected content and even looked at how the data is stored under the hood. Not bad for a bit of CLI exploration!
Testing and validating your Flow configuration
Imagine you’ve edited some Flow specification files – maybe you added a new capture or changed a collection’s schema. Before you deploy this to the cloud (i.e., publish to the catalog), you’ll want to validate that everything is correct. This includes checking that your YAML/JSON is well-formed, the schemas are valid, references to connections are accurate, and any tests you defined pass.
Flow has a concept of tests in the spec (you can define expected output given some input to verify transformations), but even without explicit tests, you can do a dry-run. The CLI provides flowctl catalog test for this purpose. It basically says, “Take my local flow specifications and build them, run any embedded tests, and report errors if something is wrong.”
Let’s run it on our current directory of Flow specs:
$ flowctl catalog test --source flow.yaml
Here, flow.yaml is the main entry point file that includes all the others (imports). (If you followed a typical workflow of pulling specs from the catalog, you’ll have a flow.yaml that references all your collections, captures, etc.)
I get output from the build/test process when I run the above. For example:
Building catalog... OK
✓ capture myOrg/sales/newOrders (PostgreSQL) validated
✓ collection myOrg/sales/orders schema validated
✓ derivation myOrg/sales/metrics tested (2/2 tests passed)
✓ materialization myOrg/sales/ordersToSnowflake validated
All validations passed!
This is a fabricated output, but it illustrates a successful test run. The capture and materialization configurations are syntactically valid, the collection’s JSON schema is okay, and two tests were passed on a derivation. The flowctl catalog test command would report errors or failures if there were any issues. For instance, if I had misnamed a collection in the capture (so it’s referencing a non-existent collection), I might see an error like “Error: capture myOrg/sales/newOrders references unknown collection myOrg/sales/order (did you mean orders?).”
Running catalog test gives you confidence before publishing changes. It’s much faster and safer to iterate locally than to push a broken spec to the cloud and then see it fail. A common beginner mistake is skipping the flowctl catalog test and going straight to flowctl catalog publish – only to have the publish rejected due to a validation error. So save yourself time and test first (I learned the easy way, thankfully, by reading the docs 😄).
For those curious, if you have explicit test cases defined in your Flow spec (under a tests: section ), the flowctl catalog test will execute them. This might involve running a snippet of a capture with sample input data and verifying the output of a derivation, etc. It’s a powerful feature for complex flows (especially derivations where you might have logic to unit test).
Other handy commands for catalogs
Beyond testing, there are a few other flowctl commands that you’ll frequently use as you develop your flows:
- Listing current catalog entities: We touched on flowctl catalog list earlier, but it’s worth mentioning in a configuration context. If you run flowctl catalog list with no arguments, it will list everything in your org’s catalog you can access (all captures, collections, materializations, etc.). You can filter by prefix or type. For example, the flowctl catalog list --prefix acmeCo/sales/ --collections would list all collections whose names start with acmeCo/sales. This is great for getting an overview or finding the exact names of things.
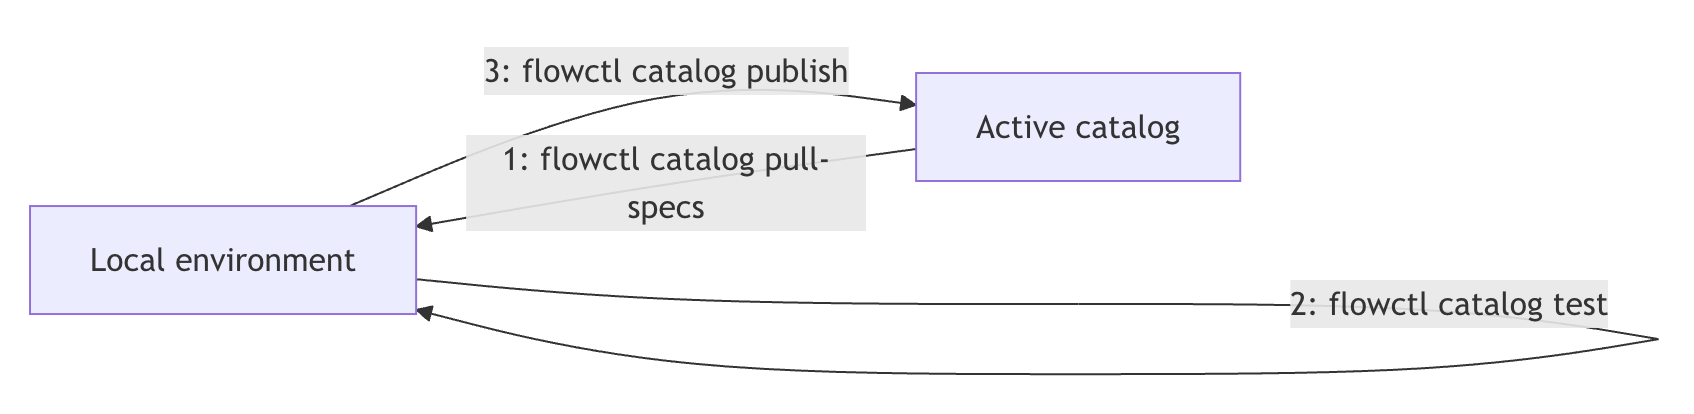
- Pulling specs: If someone on your team created a flow in the UI and you want to get the YAML spec files, use flowctl catalog pull-specs. You can pull by name or prefix. For instance, flowctl catalog pull-specs --prefix acmeCo/sales/ would fetch all the Flow spec files for everything under that prefix, writing them to your local direction. Then, you can edit them locally.
- Publishing specs: After you’ve tested your changes locally, flowctl catalog publish --source flow.yaml will push your updated specs to the cloud catalog, effectively deploying (or updating) the pipeline. Under the hood, this creates a new draft and publishes it. If something changed between when you pulled and now (like someone else edited the same flow), you might need to reconcile or re-pull, but let’s not get too far – as a beginner working solo, you likely won’t hit too many conflicts.
- Checking status: A newer command flowctl catalog status <name> gives you information about a live flow (like when it was last updated, its current checkpoint, or error state). This is still evolving, but it can be helpful to see if capture is caught up or if a materialization is lagging, for example (as of v0.5.9, this was a beta feature).
All these let you manage the life cycle of your data flow programmatically. Over time, I found myself editing YAML in VS Code, running the flowctl catalog test in a terminal pane, and once it said all was good, running the flowctl catalog publish. Then, I’d switch to the Estuary web UI to see the changes reflected and maybe monitor the pipeline’s running status. It feels pretty natural once you do it a few times. It is like a development workflow for code but with data pipelines.
Conclusion
My journey with flowctl started with curiosity and a love for the command line, but it quickly proved its value in real scenarios. Here’s a quick recap of when and why you’d reach for flowctl:
- Quick Data Peeks & Troubleshooting: Need to verify that your source connector is pulling data? flowctl collections read it lets you see documents immediately, which is faster than checking the destination system or combing through logs. If something looks off, you can catch it early.
- Automation & Integration: From incorporating Flow deployments in CI pipelines to scheduling periodic data extracts, the CLI enables scripting. Anything you click on in the UI can be invoked via flowctl commands, which means other tools or code can drive it. This is crucial for a robust DataOps practice.
- Editing & Evolving Flows Safely: Using flowctl to pull, edit, test, and publish Flow specifications give you a developer-like workflow. You can diff changes, commit them, and ensure they are correct with catalog test before affecting production. This leads to fewer mistakes and more transparency (e.g., code reviews on flow changes).
- Advanced Capabilities: As you grow with Flow, you might leverage derivations with custom code, set up role-based access, or debug performance issues. The CLI is your friend in these cases – for example, generating a TypeScript module for a complex transformation or tailing logs of a failing task (flowctl logs --task <name> is super helpful when something is erroring in the background).
Overall, flowctl brings the power-user lens to the Flow platform. It doesn’t replace the lovely UI – instead, it complements it. I often have a browser tab open to the Flow dashboard for a high-level view and a terminal where I issue precise commands or dig into details. As the Estuary team puts it, the UI and CLI together give a unified experience, and you can **“switch seamlessly between them as you build and refine your pipelines.”
I hope this exploratory guide has demystified flowctl and shown you that it’s not too daunting – even for a beginner. We went from installing it authenticating to reading data and running tests, all with simple commands. Each example barely scratched the surface, but it should give you a foundation to build on. I advise trying it out yourself: pick one of your Flow collections or use a demo source (Estuary has a Wikipedia edits demo, for instance) and use flowctl to poke around. Change a schema in a pulled spec and run a catalog test to see if it catches an error. Decrypt a config (with permission!) to see how SOPS works. This hands-on exploration will make you comfortable, and soon you’ll wield flowctl like a pro.
Happy flowing, and may your data always be in sync! 🚀
References: Estuary Flow Documentation for flowctl concepts, collections and journals, SOPS integration, and user guides. These resources go deeper and are worth checking out as you continue your Flow journey.
Member discussion